

Purpose
These tools are designed as a companion to the “Guidelines for Creating Delimiting Trapping and Visual Surveys for Adventive Plant Pests.” The tools leverage key information about pest dispersal ability, trap attractiveness, and other biological and ecological characteristics to assist in survey design and analysis. There are two components to the survey tools—delimiting trapping and visual surveys.
The delimiting trapping survey tool offers multiple designs, allowing users to choose the most suitable one based on factors such as pest dispersal ability, distribution pattern from preliminary scouting, geographic contexts, outbreak locations, and ecological characteristics. Each design is customizable to fit specific situations. After users input the required parameters, the tool simulates the probability of detection for that specific survey design over a designated survey duration.
The visual survey tool estimates the dispersal boundary of specific pests based on factors such as dispersal capability, spread speed and time since introduction, host infection or infestation rate, and host density.
Together, the tools help achieve the two primary objectives:
- Confirming the presence of the target pest via core area captures.
- Determining the spatial extent of pest distribution by establishing a boundary radius (or side length) beyond which pest captures are not likely.
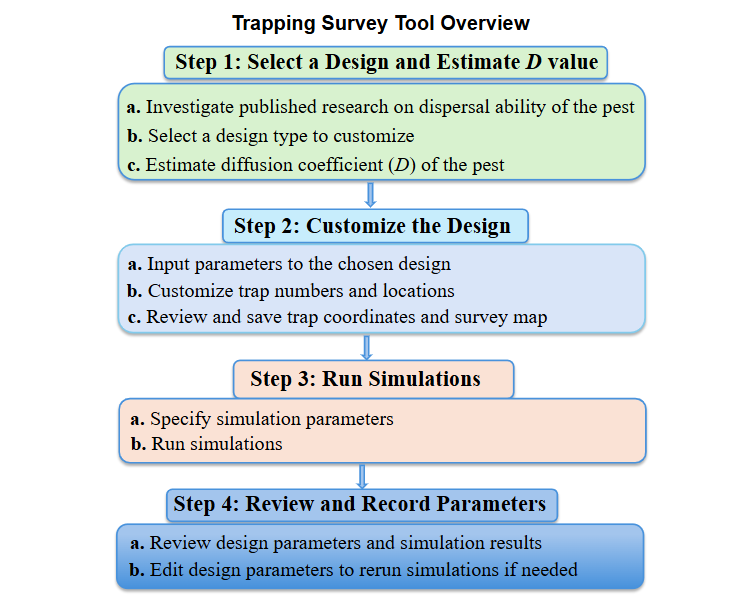
Trapping Survey Tool Features
The trapping survey tool helps to estimate:
- Diffusion coefficient: Gauge the dispersal capability of the pest.
- Survey size: Estimate boundary radius (for circular designs) or side length (for square designs) based on insect dispersal ability.
- Trap density: Trap density is based on fixed trap attractiveness and probability of detection values.
- Probability of detection: Simulates detection probabilities based on specified parameters.
After running simulations, the tool provides a summary of the survey parameters and detection probability for a selected survey grid design.
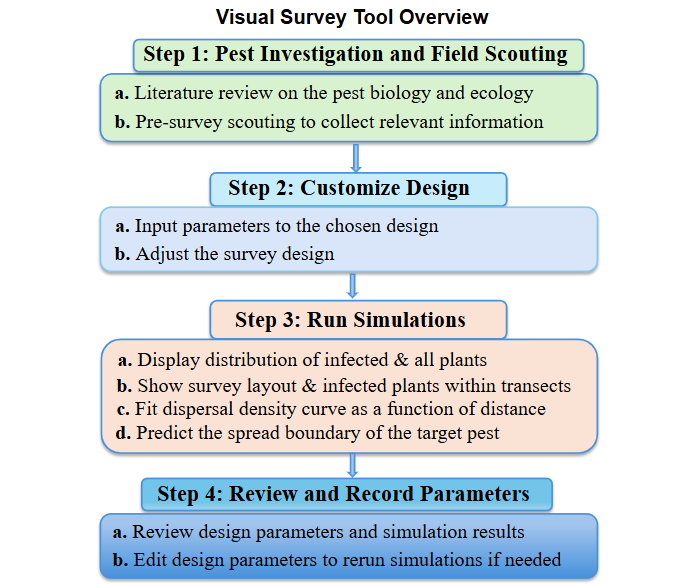
Visual Survey Tool Features
The Visual Survey Tool estimates the potential spread boundaries of specific pests based on their biological and ecological characteristics—such as pest type (pathogen, bacteria, arthropod, mollusk, and weeds), rate of spread, time since introduction, vectors, host, spread pathway, and infestation rate. Users can customize survey transects by adjusting their lengths, widths, and numbers. Based on the chosen pest prevalence and desired survey confidence level, the tool simulates and displays:
- The distribution of infected/infested versus total hosts.
- The positions of infected plants within transect survey area.
The final output includes the predicted pest spread boundary and a summary of key survey parameters, offering valuable guidance for effective survey planning.
Requirements and Limitations of the Survey Tools
- A computer with internet access.
- We recommend using the tools along with the “Guidelines for Creating Delimiting Trapping and Visual Surveys for Adventive Plant Pests.”
- Guidelines and tools are provided for the benefit of users. USDA and NC State University are not responsible for survey results.
- A slight difference between mapped locations and ideal number of traps is likely.
General Instructions
- Complete all required input fields for each step to generate a final design.
- Blanks indicate fields requiring user input.